Key Quality Control Metrics to Measure Your Success in a Service Business
Listen to this article

Ryan Pease
FOLLOW
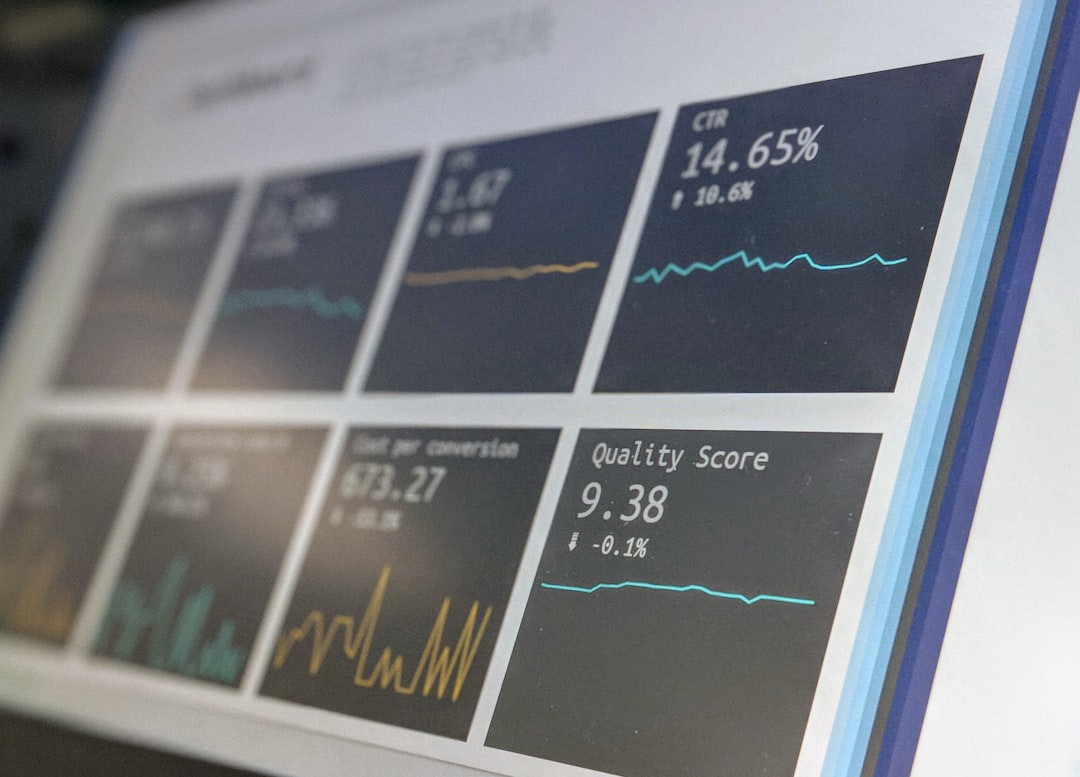
Most small business owners know when quality is slipping. A client complains. A deliverable gets sent back. A team member quietly redoes someone else's work for the third time this month. The signals are there, but without a structured way to capture them, they stay invisible until the damage is done.
That is the core problem with quality in founder-led service businesses: it tends to live in people's heads, in gut feelings, and in the memory of whoever has been around the longest. When quality is invisible, it cannot be measured. When it cannot be measured, it cannot be improved in any consistent, scalable way.
This guide is written specifically for service businesses, not manufacturers. If you run a marketing agency, an IT firm, a consulting practice, a specialty healthcare business, or any other founder-led operation with repeatable delivery, this is the practical resource that the broader internet has not yet given you. It covers what quality control metrics actually are, which ones matter most for service-based SMBs, how to build a simple system for tracking them, and why none of it works without documented standards as a foundation.
What Are Quality Control Metrics (and Why Most SMBs Ignore Them Until It Is Too Late)
Quality control metrics are quantifiable indicators used to evaluate whether a process, service, or deliverable meets a defined standard. The key word is "quantifiable." A metric is not a feeling or an impression. It is a number that tells you something specific about how well a process is performing relative to an expectation.
In plain terms: if your standard is that client reports go out within 48 hours of a project milestone, and your metric shows that 30 percent of reports are going out after 72 hours, you now have an actionable signal. Without the metric, you just have a vague sense that things feel a little slow lately.
It helps to distinguish between three related terms that often get conflated:
Measurements are raw data points, such as the number of errors found in a deliverable.
Metrics are measurements given context, such as the error rate expressed as a percentage of total deliverables.
KPIs (Key Performance Indicators) are metrics tied to a strategic target and a threshold that triggers action. For example, an error rate KPI might be "keep rework below 5 percent of total project hours."
Most SMBs skip all three. They operate on instinct and experience, which works fine when the team is small and the founder is involved in every project. But as soon as the business grows past the point where one person can personally oversee every deliverable, quality becomes inconsistent. That inconsistency is expensive. Rework eats margin. Client dissatisfaction erodes retention. And the founder ends up back in the weeds, firefighting problems that a simple measurement system could have caught weeks earlier.
The cost of not measuring quality is not just operational. It is financial. It is reputational. And it compounds over time.
Quality Control Metrics for Service Businesses: A Different Set of Rules
Almost every article ranking for quality control metrics is written for manufacturers. They talk about defect rates per unit, yield percentages, scrap rates, and Six Sigma tolerances. Those frameworks are genuinely useful if you are running a production line. They are largely irrelevant if you are delivering consulting engagements, managing client accounts, or dispatching field technicians.
Service businesses have a fundamentally different quality challenge. The "product" is often intangible. Delivery happens through people, not machines. The standard for "good" can vary by client, by project type, or by the team member handling the work. And unlike a manufactured widget, a poorly delivered service cannot be recalled and replaced. The damage is relational.
This means the quality control metrics that matter for a service business are organized around three things that manufacturers rarely prioritize in the same way:
Consistency of process execution: Are your team members following the agreed steps, in the agreed order, every time?
Quality of the human experience: Is the client or customer receiving something that meets or exceeds their expectations, not just technically but experientially?
Speed and reliability of delivery: Is work being completed on time, and does that completion actually represent what "done" means by your internal standard?
When measuring quality in a service business, the goal is not zero defects in a mechanical sense. It is reliable, repeatable delivery that a growing team can execute without the founder in the room.
The Three Layers of Quality Metrics Every Service Business Should Track
Rather than chasing a single number, service businesses benefit from thinking about quality across three distinct layers. Each layer answers a different question.
Layer 1: Process Quality (Are Steps Being Followed?)
Process quality metrics measure whether your team is executing the defined steps of a workflow correctly and consistently. Examples include SOP adherence rates, checklist completion rates, and audit scores on internal reviews. These are leading indicators. They tell you about the health of your operations before problems reach the client.
Layer 2: Output Quality (Is the Deliverable Meeting Standards?)
Output quality metrics measure the actual result of the work. This includes error rates, rework rates, revision cycles, and internal review pass rates. These are closer to real-time signals. They catch problems after the work is done but ideally before it reaches the client.
Layer 3: Customer Quality (Is the Client Satisfied and Returning?)
Customer quality metrics measure how clients experience the service. This includes Net Promoter Score (NPS), customer satisfaction scores, complaint rates, churn rates, and renewal or repeat engagement rates. These are lagging indicators. By the time they move in the wrong direction, problems have already occurred. But they are essential for understanding the downstream impact of process and output failures.
A healthy quality measurement system covers all three layers. Over-indexing on just one creates blind spots. Businesses that only watch customer satisfaction scores often miss the process breakdowns that are quietly eroding delivery quality. Businesses that only track internal metrics can lose sight of whether clients actually value what is being produced.
The Core Quality Control Metrics That Actually Matter for SMBs
With the three-layer framework in mind, here are the specific metrics that matter most for founder-led service businesses. These are the numbers worth building a system around.
Error and Rework Rate
The error rate measures how often a deliverable or task contains a mistake that requires correction. The rework rate measures what percentage of total work hours are spent fixing those mistakes.
A simple formula for error rate: (Number of deliverables requiring correction / Total deliverables produced) x 100.
For example, if your team produces 40 client reports in a month and 6 of them require revisions due to errors, your error rate is 15 percent.
Rework is a hidden cost multiplier. If a team member spends 20 percent of their time correcting work that should have been right the first time, that is essentially one day per week of productivity lost to quality failure. Across a team of ten people, that becomes a significant drag on capacity and margin.
Customer Complaint Rate
The complaint rate tracks how often clients formally or informally raise a concern about the quality of service. It is calculated as: (Number of complaints / Total client interactions or projects) x 100.
Complaints are not just lagging indicators. When tracked consistently over time, patterns in complaint categories can become leading indicators of systemic process problems. If five clients in one quarter all complain about communication gaps during project handoffs, that is a process problem, not a people problem.
On-Time Delivery Rate
On-time delivery measures the percentage of tasks, projects, or deliverables completed by the agreed deadline. Formula: (Number of on-time completions / Total completions) x 100.
In service businesses, missed deadlines are rarely just a scheduling issue. They usually signal upstream process breakdowns: unclear handoffs, missing inputs, insufficient capacity planning, or steps that were skipped and are now catching up. Tracking on-time delivery as a quality metric, not just a project management metric, reframes it as a signal about process health.
Client Retention Rate
Retention measures the percentage of clients who continue engaging with the business over a defined period. For service businesses, this is one of the most meaningful quality metrics available. Clients who consistently receive high-quality service renew, refer, and expand. Those who experience inconsistent quality quietly leave.
First-Time Resolution Rate
This metric tracks how often a client issue or request is resolved correctly on the first attempt without requiring follow-up corrections. High first-time resolution rates indicate strong process execution and clear communication. Low rates indicate gaps in either the process, the training, or both.
Net Promoter Score (NPS)
NPS asks clients a single question: how likely are they to recommend the business to a colleague or peer? Scores range from negative 100 to positive 100. For service businesses, NPS is a useful proxy for overall quality perception, especially when tracked over time and correlated with specific service types or team members.
Quality Metrics vs. Quality KPIs: What Is the Difference and Why It Matters
This distinction matters more than most business owners realize. A metric is a measurement. A KPI is a metric with a target, a threshold, and an owner.
Tracking an error rate of 12 percent is a metric. Saying "our error rate must stay below 5 percent, measured monthly by the project lead, and any breach triggers a process review within two weeks" is a KPI.
The difference is that a KPI creates accountability and action. A metric sitting in a spreadsheet with no target and no owner is just information. It does not drive behavior or improvement.
The most common mistake SMBs make when building quality systems is creating dashboards full of metrics that look impressive but have no strategic connection. Every number on a quality dashboard should answer the question: "If this number moves outside its target range, what do we do?" If the answer is "we are not sure," it is not a KPI yet. It is still just a metric.
To turn a metric into an actionable KPI, three things need to be defined: the target value, the review frequency, and the person responsible for acting when the threshold is breached.
Why You Cannot Measure Quality Without a Standard: The SOP Foundation
Here is the part that most quality control articles skip entirely: quality metrics are only meaningful when there is a documented standard to measure against.
Think about what an error rate actually measures. It measures the gap between what was expected and what was delivered. But if the expected standard has never been written down, who decides what counts as an error? Usually the person reviewing the work. And if that person changes, or is unavailable, or has a different interpretation than the original creator, the standard shifts. The metric becomes meaningless because it is measuring against an invisible, moving target.
Standard operating procedures (SOPs) are the foundation of measurable quality control. They define the expected behavior, the correct sequence of steps, the acceptable output, and the standard for "done." Once that standard exists in documented form, every metric becomes a comparison: actual performance against documented expectation.
The SOP-to-metric pipeline works like this:
Document the process as an SOP, including the expected steps, sequence, and output standard.
Identify the measurable checkpoints within that process where quality can be evaluated.
Define what "good" looks like at each checkpoint, expressed as a number or a binary pass/fail.
Assign someone to monitor those checkpoints and record the results.
Review the data on a defined cadence and act on deviations.
Without step one, steps two through five are guesswork. This is why businesses that try to implement quality metrics before documenting their processes almost always end up with dashboards that nobody trusts or uses. The metrics feel arbitrary because they are. There is no agreed standard behind them.
SOP compliance itself can also be a metric. Tracking the percentage of tasks completed using the documented procedure, versus improvised approaches, is a powerful leading indicator of quality consistency. When SOP compliance drops, quality problems typically follow within weeks.
The Hidden Quality Metric No One Tracks: Key-Person Dependency
There is a quality risk sitting inside most founder-led service businesses that never appears on any dashboard. It is key-person dependency: the degree to which quality outcomes depend on one or two specific individuals being present and involved.
When a business has high key-person dependency, quality is not actually a function of the process. It is a function of who is doing the work. The founder, the senior account manager, or the longest-tenured team member produces excellent results because they carry the institutional knowledge in their head. Everyone else produces inconsistent results because they are working from incomplete information and informal guidance.
This creates a distorted quality picture. Average metrics look acceptable because the key person's output is pulling up the numbers. But the moment that person is unavailable, on leave, or exits the business, quality collapses. The metrics were never measuring the process. They were measuring the person.
Key-person dependency can be tracked in a few ways. One approach is to compare quality metrics by team member or role, looking for outliers who consistently outperform the rest. Another is to track what percentage of client-facing decisions or quality checks require escalation to a specific individual. A third is to review how quality metrics shift during periods when a key person is absent.
The solution to key-person dependency is documentation. When the knowledge that produces quality outcomes is captured in SOPs, checklists, and process guides, it becomes transferable. Quality stops being a person-dependent outcome and starts being a system-dependent one. That is what makes a business scalable.
How to Implement Quality Control Metrics Without a Dedicated QA Team
Most SMBs do not have a quality assurance department. They have a founder, a handful of managers, and a team of people who are already stretched across multiple responsibilities. The good news is that a meaningful quality measurement system does not require a dedicated QA function. It requires clarity, ownership, and simplicity.
Step 1: Identify Which Processes to Measure First
Start with the processes that have the highest impact on client experience and business revenue. For most service businesses, this means client onboarding, core delivery workflows, and client communication touchpoints. Do not try to measure everything at once. Pick two or three critical processes and build the measurement habit there first.
Step 2: Document the Standard Before Measuring Against It
Before tracking any metric, make sure the expected standard is documented. This does not need to be a 20-page manual. A clear, step-by-step SOP with defined outputs and checkpoints is enough. Without this, the metrics will be arbitrary.
Step 3: Define the Metric and Set a Baseline
Choose a specific, measurable indicator for each process. Set a baseline by measuring current performance before making any changes. The baseline becomes the starting point against which all future performance is compared. Without a baseline, there is no way to know whether interventions are working.
Step 4: Assign Ownership
Every metric needs a named owner. Not a team. Not a department. A specific person who is responsible for monitoring the metric, reporting on it at the agreed frequency, and escalating when it falls outside the target range.
Step 5: Schedule Reviews and Build in Corrective Action Triggers
Decide how often each metric will be reviewed (daily, weekly, or monthly depending on the process) and what happens when a metric breaches its threshold. The review cadence and the corrective action protocol should be documented so they happen consistently, not just when someone remembers to look.
Assigning Quality Metric Ownership When You Do Not Have a QA Team
Every article on quality control metrics assumes there is a quality assurance team somewhere in the organization. For businesses with 10 to 50 employees, that assumption is wrong, and it leads to a practical dead end.
In a small team, quality metric ownership needs to be embedded in existing roles. Here is how to do it without creating new headcount or overloading people who are already at capacity.
Match Ownership to Process Proximity
The best owner for a quality metric is usually the person closest to the process being measured. If the metric is about client onboarding quality, the account manager or onboarding lead owns it. If the metric is about deliverable error rates, the project lead owns it. Ownership should feel natural, not like an additional burden dropped on someone unrelated to the work.
Separate Monitoring from Reporting
The metric owner does not need to do all the data collection themselves. In many cases, data collection can be built into existing workflows through checklists, project management tools, or simple tracking sheets. The owner's job is to review the compiled data, identify trends, and act on deviations. This distinction makes ownership more manageable.
Use Role-Based Accountability, Not Personality-Based
Ownership should be attached to a role, not a person. When team members know that the project lead role carries responsibility for tracking the error rate, that accountability survives personnel changes. If ownership is informally assigned to "Sarah because she is good at this," it disappears the moment Sarah moves on.
Review Metrics in Existing Meetings
Rather than creating new quality review meetings (which rarely survive contact with a busy calendar), embed quality metric reviews into meetings that already happen. A weekly team standup can include a 90-second review of two or three key metrics. A monthly leadership meeting can include a deeper review of trend data. The goal is to make quality review a habit, not an event.
Building a Simple Quality Metrics Dashboard for Your Team
A quality dashboard does not need to be sophisticated. For most SMBs, the best dashboard is the one the team actually looks at and acts on. Complexity is the enemy of adoption.
What to Include
A practical quality dashboard for a 10 to 50-person service business should include five to eight metrics maximum. More than that and it becomes noise. Each metric should show the current value, the target, and a simple indicator of whether performance is on track, at risk, or off track. Traffic light color coding (green, yellow, red) works well for quick visual scanning.
Review Cadence
Different metrics warrant different review frequencies. Process-level metrics (SOP adherence, checklist completion) benefit from weekly review because they are leading indicators and early intervention matters. Output metrics (error rate, first-time resolution) are well suited to bi-weekly or monthly review. Customer metrics (NPS, retention, complaint rate) are typically reviewed monthly or quarterly.
Tools That Work for Small Teams
The tool matters less than the habit. Many small service businesses run effective quality dashboards in a shared Google Sheet or Notion page. Project management platforms like Asana, ClickUp, or Monday.com can surface relevant data if workflows are structured to capture it. The key is that the dashboard is visible, regularly updated, and connected to a review process. A beautiful dashboard that nobody opens is worthless.
The SMB Quality Metrics Starter Checklist: 7 Metrics to Track Before Anything Else
If the business has no existing quality measurement system, starting with seven metrics is more than enough. These seven cover all three layers (process, output, and customer) and give a meaningful picture of quality health without overwhelming a small team.
SOP Adherence Rate: What percentage of tasks are being completed using the documented procedure? This is the foundational process quality metric.
Error and Rework Rate: What percentage of deliverables require correction before or after client delivery? This reveals the hidden cost of quality failures.
On-Time Delivery Rate: What percentage of projects or tasks are completed by the agreed deadline? This signals process and capacity health.
First-Time Resolution Rate: What percentage of client issues or requests are resolved correctly on the first attempt? This measures both process clarity and team capability.
Customer Complaint Rate: How many formal or informal complaints are received per project or per client interaction? This is a leading signal of systemic quality problems.
Net Promoter Score (NPS): How likely are clients to recommend the business? This is the single best proxy for overall quality perception.
Client Retention Rate: What percentage of clients renew, return, or expand their engagement? This is the ultimate lagging indicator of sustained quality.
Start by establishing a baseline for each of these seven metrics over a 30 to 60-day period. Then set targets based on that baseline and industry benchmarks. Assign an owner to each metric and build the review into an existing meeting rhythm. That is a quality measurement system. It does not require a QA team, a dedicated platform, or months of setup.
Common Quality Control Metric Mistakes SMBs Make
Even businesses that commit to measuring quality often fall into predictable traps. Recognizing these mistakes early saves a lot of wasted effort.
Tracking Vanity Metrics Instead of Actionable Ones
Vanity metrics look good but do not drive decisions. The number of projects completed in a month is a vanity metric if it is not connected to quality, margin, or client satisfaction. Always ask: "If this number changes, what action does that trigger?" If the answer is nothing, the metric is decorative.
No Baseline or Target Before Measuring
Starting to track a metric without first establishing a baseline makes it impossible to know whether performance is improving, declining, or simply normal. The baseline is the reference point. Without it, the data is context-free.
Metrics That Live in a Spreadsheet Nobody Reviews
This is the most common failure mode. A well-intentioned quality initiative produces a tracking spreadsheet that gets updated for three weeks and then quietly abandoned. Metrics only drive improvement when they are reviewed on a defined cadence by someone with the authority and responsibility to act on them.
Too Many Metrics, Too Little Focus
Tracking 25 quality metrics sounds thorough. In practice, it dilutes attention and makes it impossible to know which numbers actually matter. For most SMBs, five to eight well-chosen metrics with clear targets and owners will outperform a sprawling dashboard that nobody can summarize.
Metrics Without Corrective Action Protocols
A metric that triggers no response when it falls outside its target range is not a KPI. It is just a number. Every quality metric should have a documented response: who is notified, what is investigated, and what corrective action is expected within what timeframe.
The Cost of Quality: A Financial Framework for Service Businesses
The cost of quality (CoQ) framework gives business owners a way to see quality as a financial lever, not just an operational one. It organizes quality-related costs into four categories:
Prevention costs: Investments made to prevent quality failures before they occur. For service businesses, this includes SOP development, staff training, and process design.
Appraisal costs: The cost of evaluating quality, such as internal reviews, audits, and quality checks before delivery.
Internal failure costs: The cost of quality failures caught before they reach the client, including rework, corrections, and scrapped work.
External failure costs: The cost of quality failures that reach the client, including complaint resolution, refunds, relationship repair, and lost future revenue.
Most SMBs dramatically underinvest in prevention and appraisal because those costs are visible and immediate. They dramatically underestimate internal and external failure costs because those costs are diffuse and often invisible (rework absorbed by team members, clients who leave without complaining, referrals that never happen).
When framed through the CoQ lens, investing in SOPs and quality metrics is not an overhead expense. It is a strategy for reducing the far more expensive failure costs that accumulate when quality is left to chance.
Frequently Asked Questions About Quality Control Metrics
What are some key quality metrics?
For service businesses, the most important quality metrics include error and rework rate, on-time delivery rate, customer complaint rate, first-time resolution rate, Net Promoter Score, and client retention rate. SOP adherence rate is also critical for businesses that have documented their processes and want to measure how consistently those standards are being followed.
What is the KPI for quality?
A quality KPI is a metric that has been tied to a specific target, a review frequency, and an owner who is responsible for acting when performance falls outside the target range. Common quality KPIs for service businesses include keeping the rework rate below a defined percentage, maintaining an NPS above a threshold score, and achieving an on-time delivery rate above a set target. The specific numbers vary by business and should be set based on baseline data and strategic goals.
What are some quality control measures?
Quality control measures for service businesses include SOP compliance audits, internal deliverable reviews before client delivery, client satisfaction surveys, complaint tracking systems, peer review processes, and regular quality metric reviews in team meetings. The most effective measures are those embedded into existing workflows rather than treated as separate quality activities.
What are five examples of metrics to measure performance?
Five strong performance metrics for a service business are: (1) on-time delivery rate, (2) error and rework rate, (3) customer complaint rate, (4) client retention rate, and (5) first-time resolution rate. Each of these measures a different dimension of performance and together they provide a balanced view of operational and quality health.
How do you measure quality in a service business?
Measuring quality in a service business requires three things: documented standards (SOPs) that define what good looks like, metrics that compare actual performance against those standards, and a review process that connects metric data to corrective action. Without documented standards, quality measurement is subjective. Without a review process, metric data sits unused. All three components are necessary for a functioning quality measurement system.
What are the five key customer experience (CX) metrics?
The five most commonly tracked CX metrics are Net Promoter Score (NPS), Customer Satisfaction Score (CSAT), Customer Effort Score (CES), customer churn rate, and first-contact resolution rate. For service businesses, NPS and churn rate tend to be the most strategically meaningful because they reflect the cumulative quality of the client relationship over time, not just a single interaction.
Turning Quality Control Metrics Into a Scalable System
The goal of tracking quality control metrics is not to generate reports. It is to build a business that delivers consistent, high-quality outcomes regardless of who is in the room, which team member is handling the project, or whether the founder is available to catch problems before they reach the client.
That level of consistency is not achieved by measuring more things. It is achieved by documenting the standards that define quality, tracking the handful of metrics that reveal whether those standards are being met, assigning clear ownership for each metric, and building a review rhythm that keeps quality visible in the day-to-day operation of the business.
For founder-led service businesses, this is the path from a quality experience that depends on the right people being present, to a quality system that the whole team can run. It is also the foundation for scaling: because when quality is documented, measured, and owned, it can be replicated, trained, and transferred as the team grows.
The metrics are not the destination. They are the instrument panel that tells you whether the system is working. And the system starts with the standard. Document first. Measure second. Improve continuously.
Check out other interesting articles here 👇

Why Free Acceptable Use Policy Templates Destroy Enterprise Value
The Hidden Tax: How Operational Chaos is Bleeding Your Business Dry

The Architecture of Operational Freedom: Engineering a Business That Runs Without You

What is an SOP in Business? The Architecture to Escape the Founder Trap

I Built a 6 Million Dollar Company That Couldn't Run Without Me

How to Build a Business That Works (Hint: Systems!)

Employee Onboarding and Training: A Practical Guide for Small and Medium Businesses

How to Write Standard Operating Procedures for Manufacturing: A Field-Proven Blueprint

Essential Quality Control Practices for Operational Excellence

How Standardized Processes Drive Operational Efficiency and Growth